
How to use Flutter Widget Inspector in Android Studio? Read this tutorial.
If you need to debug layout problems or you want to know the widget tree of your Flutter application, it can be done using Flutter Widget Inspector. This tutorial shows you how to use Flutter Widget Inspector with Android Studio IDE.
Using Flutter Widget Inspector in Android Studio
In order to run the widget inspector, you need to run the application first, either on an emulator or a real device.
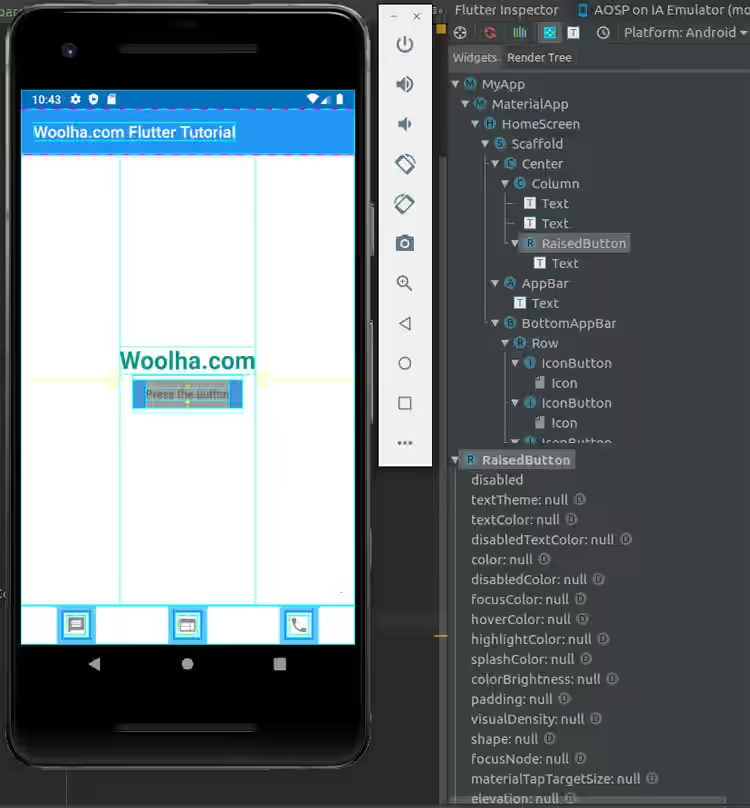
There are some tabs on the right side of Android Studio, one of which should be Flutter Inspector. You need to click on the tab for toggling whether the Flutter Inspector window should be visible or hidden. When the window is visible, there are two tabs, Widgets and Render Tree.
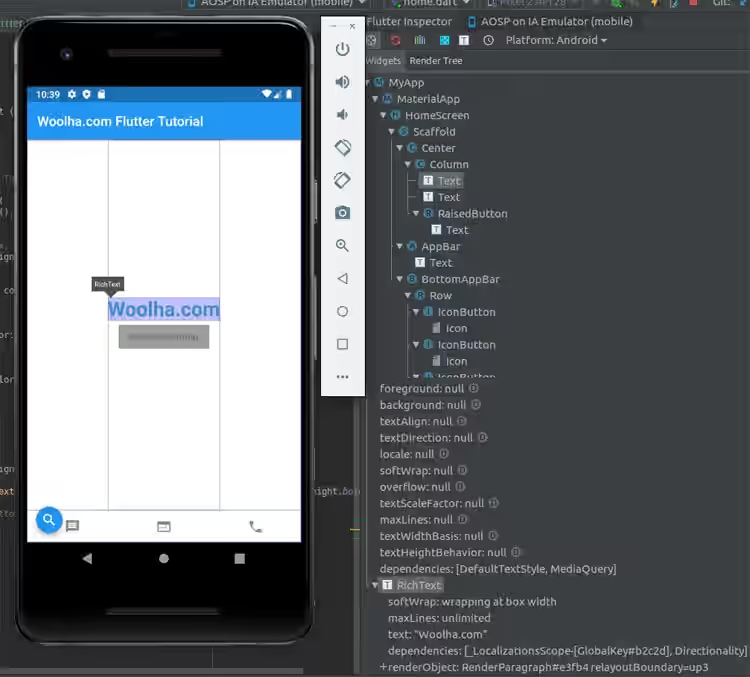
On the Widgets tab, you can see the list of widgets in a tree structure. Selecting a widget shows the properties and details of the widget.
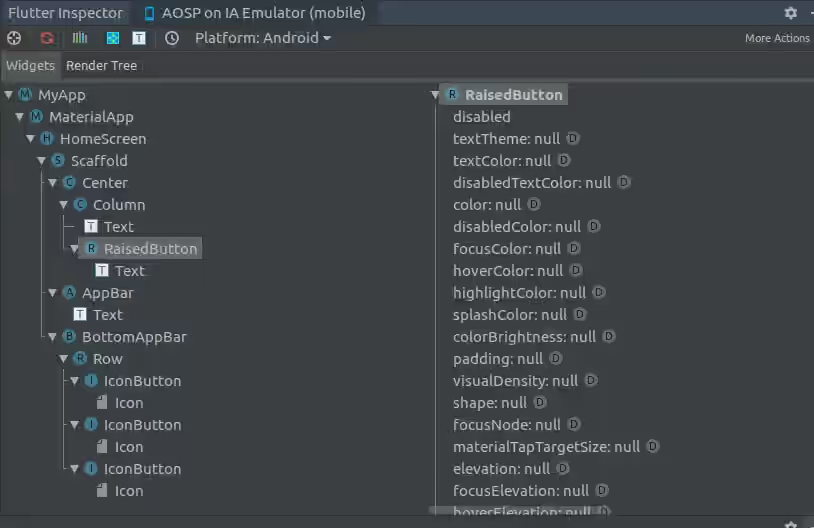
The RenderTree tab displays the render tree of the widgets. It allows you to understand how Flutter converts widgets into RenderObjects.
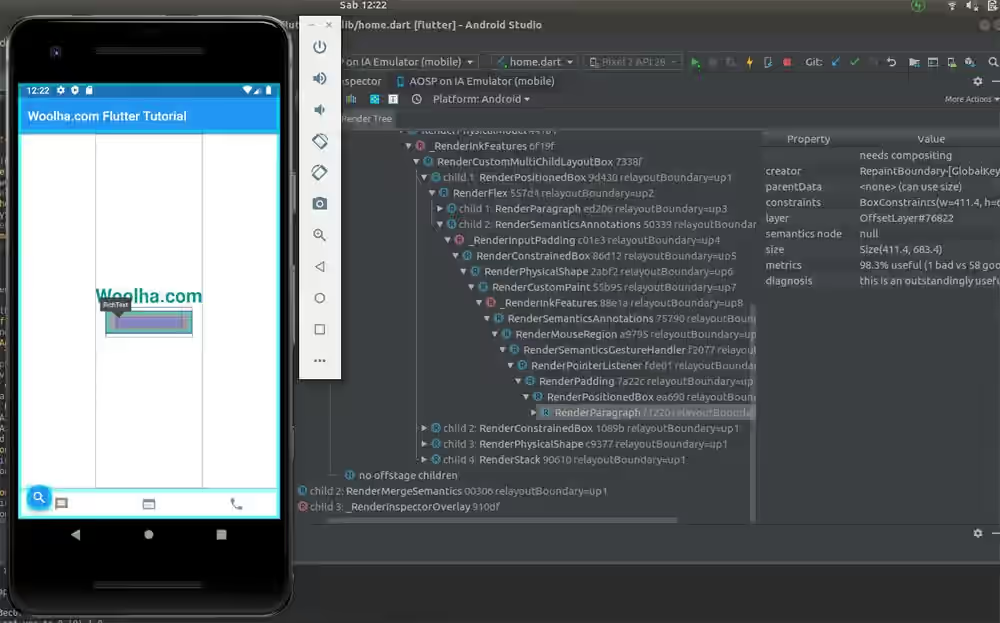
On the top of the Widget Inspector window there are some icons and a 'More actions' dropdown. Below is the list of the features in Flutter Widget Inspector.
Select Widget Mode 
You can enable/disable select widget mode by clicking on the icon. If the select widget mode is enabled, you can click on a widget on the screen and the selected widget in the inspector will follow what is being selected on the screen. On the contrary, if you select a widget in the inspector, it will update the selected (highlighted) widget on the screen.
Refresh Widget Info 
The refresh widget info icon is used for refreshing the widget tree. If you add or remove a widget and use hot reload, you need to press this icon in order to update the widget tree in the inspector.
Performance Overlay 
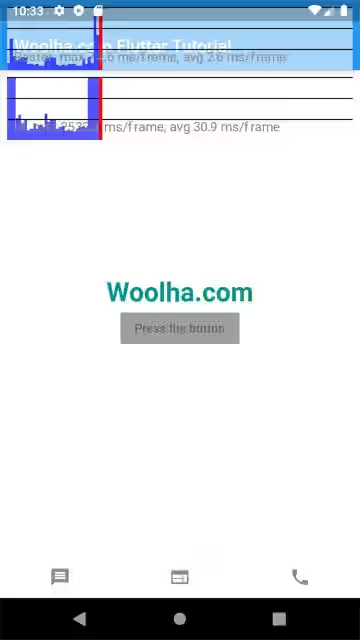
If performance overlay is enabled, the maximum and average frame rate (ms/frame) for raster and UI will be displayed on the screen in the form of graphs.
Show Debug Paint 
Enabling show debug paint allows you to see how each widget is rendered. It shows the borders, padding, alignment, and spaces of the widgets displayed on the screen.
Show Paint Baselines 
If this is enabled, it will cause each RenderBox to paint its text baselines with a line.

Slow Animations 
It can be used to slow down animations to make inspection possible.
Show Repaint Rainbow 
If this is enabled, it will show rotating colors on layers when repainting.

Show/Hide Debug Mode Banner 
This allows you to show/hide debug mode banner when running a debug build.
That's how to use the Flutter Widget Inspector in Android Studio.
