Website performance is an important thing for both SEO and user experience. Therefore, it's also important to know how fast your website can give response. The performance is usually affected by load. Given your resources are very limited, it may be very slow during busy hours and much faster at the other times. One of website performance measurement is latency. Latency is the time between request sent and response received by the client (usually web browser)
There are many tools or services for monitoring latency. The biggest Internet company, Google, provides this service as well. They have Stackdriver Trace as a part of their cloud platform. Stackdriver Trace is a distributed tracing system. It analyzes the trace of your application to generate detailed latency reports. It also provides daily performance reports and detection of latency degradation. In this tutorial, I'm going to show you how to use Stackdriver Trace to track latency of your Node.js application.
Preparation
1. Create or select a Google Cloud project
A Google Cloud project is required to use this service. Open Google Cloud console, then create a new project or select existing project
2. Enable billing for the project
Like other cloud platforms, Google requires you to enable billing for your project. If you haven't set up billing, open billing page.
3. Enable Cloud Trace API
To use an API, you must enable it first. Open this page to enable Cloud Trace API.
4. Set up service account for authentication
As for authentication, you need to create a new service account. Create a new one on the service account management page and download the credentials, or you can use your already created service account.
In your .env file, you have to add a new variable
GOOGLE_APPLICATION_CREDENTIALS=/path/to/the/credentialsDependencies
This tutorial uses @google-cloud/trace-agent and also dotenv for loading environment. Add the following dependencies to your package.json and run npm install
  "@google-cloud/trace-agent": "~3.1.0"
  "dotenv": "~4.0.0"
Code Examples
The following is a basic example of how to use Stackdriver Trace on Node.js application. Put the code below at the "beginning of your app". For example if you start your application by running node app.js, put it at the beggining of app.js or the first loaded module.
  require('dotenv').config();

  require('@google-cloud/trace-agent').start({
    samplingRate: 500, // Sample one trace every half-second.
    ignoreUrls: [ /^\/dashboard#/ ] // "/dashboard" endpoint will be ignored.
  });
There are only two configs on the example above. For full list of supported configs, see the table below.
| Name | Type | Description |
|---|---|---|
clsMechanism? |
string |
Trace context propagation mechanism to use. Options:
|
logLevel? |
number |
Log levels: 0=disabled, 1=error, 2=warn, 3=info, 4=debug. The value of GCLOUD_TRACE_LOGLEVEL takes precedence over this value. |
enabled? |
boolean |
If false, Trace Agent will be disabled. |
enhancedDatabaseReporting? |
boolean |
If true, additional information about query parameters and results will be attached (as labels) to spans representing database operations. |
rootSpanNameOverride? |
string | ((name: string) => string) |
A value used to override names of root spans. |
maximumLabelValueSize? |
number |
Maximum number of characters reported on a label value, cacnnot exceed 16383 |
plugins? |
|
List of trace plugins to load. The key is the name of the module, while the value is a path to the plugin (like using require) |
stackTraceLimit? |
number |
Max number of frames to include on traces. (set to 0 to disable) |
flushDelaySeconds? |
number |
Time delay in second before buffer published to trace API. |
ignoreUrls? |
Array |
Ignore URL that matches the regex. |
samplingRate? |
number |
Upper bound on the number of traces to gather each second. (max is 1000, set to 0 to disable) |
bufferSize? |
number |
Size of transaction buffered before published to trace. |
onUncaughtException? |
string |
Specifies the behavior of the trace agent in the case of an uncaught exception.
|
ignoreContextHeader? |
boolean |
Allows to ignore the requests X-Cloud-Trace-Context header if set |
credentials? |
|
Contents of a key file. |
keyFilename? |
string |
Path to a key file. |
serviceContext? |
|
Specifies associated service context, |
After adding the code, restart your app and try to send some requests. If it succesful, it will send data to Stackdrvier Trace API.
Viewing the Stackdriver Trace console
Open this page in order to show the console.

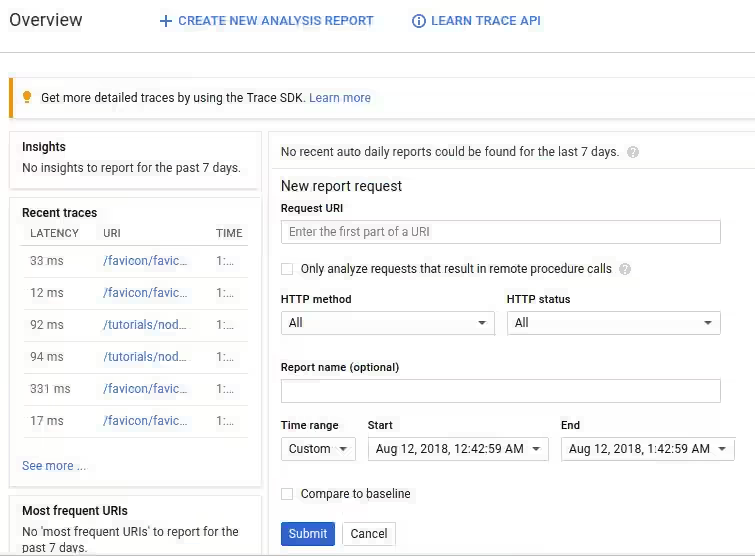
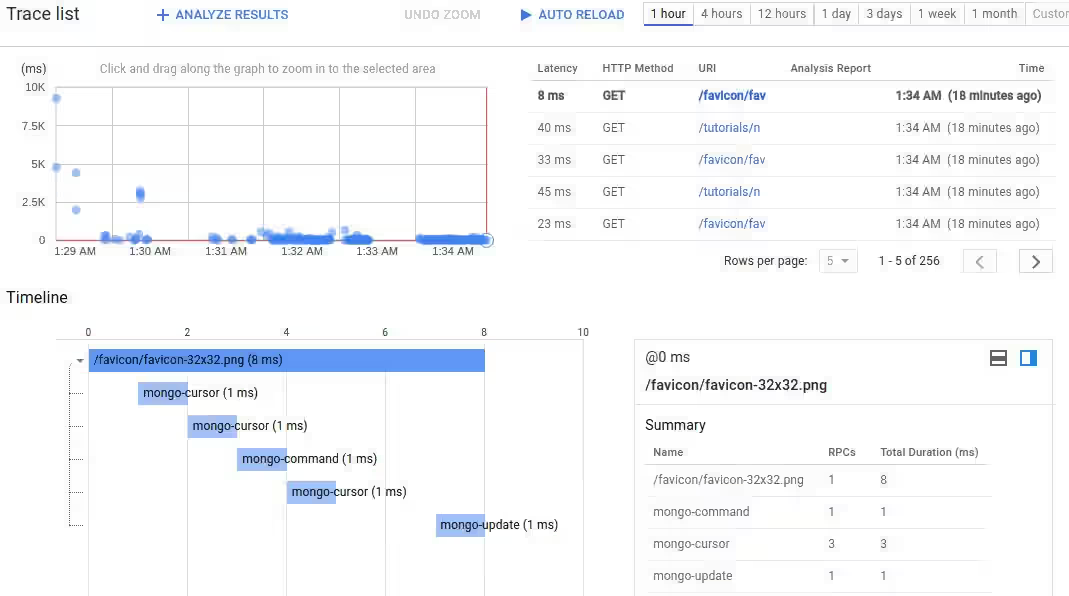
There you'll see insight, recent traces, form to create report, etc. On the Recent Traces section, click on See More to view all traces. Then you can cilck on a URI to view the latency graph for that URI. There's also a timeline where you can see how long is each processes before your application can give response.

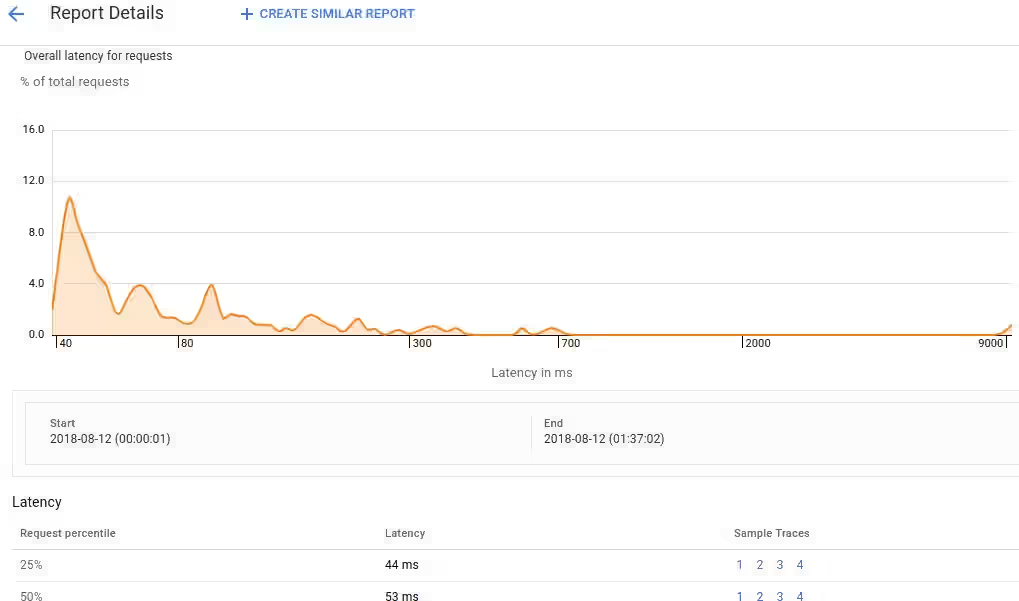
You can also create a new report by specifying Request URI, HTTP method, HTTP status, time range, and optional report name. On the report, there's a graph containing latency distribution for that URI.

That's all about how to use Stackdriver Trace in your Node.js application. It's quite simple but very useful for generating latency reports.
