Debugging is a process of finding bugs in source code. Besides analyzing how the code work, what programmers usually do while debugging is getting the value of some variables and printing texts and variables in order to understand code execution flow and get the snapshot of variables at a certain point. Debugging is usually done by adding breakpoint at certain line of code, analyzing the variables, then continue the code execution. Another way is by printing some texts and variables and let the code execute without having to stop the application. The disadvantage of the first solution is you can't debug in that way in production as it will affect or at least delay the code execution. The second way is not an elegant solution, even it may cause additional errors because of typos or printing wrong variables. To overcome those problems, we need a debugger that allows us to capture snapshots of variables and add some texts and variables to print, but without affecting code execution or modifying the code. One of the solutions that's easy to implement is using Google Stackdrvier Debugger.
Google Stackdriver Debugger allows you to debug application in real time without stopping or slowing down the application. It doesn't affect code execution as well because you don't need to modify your code. The Debugger allows you to capture snapshots at specified line and also print any texts or variables. It's also compatible with popular code repositories which include Github, Bitbucket, Gitlab, and Google's own Cloud Source Repository. In addition, with online debugger, you can easily collaborate to find those hard-to-find bugs.
Preparation
1. Create or select a Google Cloud project
A Google Cloud project is required to use this service. Open Google Cloud console, then create a new project or select existing project
2. Enable billing for the project
Like other cloud platforms, Google requires you to enable billing for your project. If you haven't set up billing, open billing page.
3. Enable Cloud Debugger API
To use an API, you must enable it first. Open this page to enable Cloud Debugger API.
4. Set up service account for authentication
As for authentication, you need to create a new service account. Create a new one on the service account management page and download the credentials, or you can use your already created service account.
In your .env file, you have to add a new variable
GOOGLE_APPLICATION_CREDENTIALS=/path/to/the/credentialsDependencies
This tutorial uses @google-cloud/debug-agent and also dotenv for loading environment. Add the following dependencies to your package.json and run npm install
  "@google-cloud/debug-agent": "~2.6.0"
  "dotenv": "~4.0.0"
Code Examples
The following is a basic example of how to use Stackdriver Debugger on Node.js application. Put the code below at the "beginning of your app". For example if you start your application by running node app.js, put it at the beggining of app.js or the first loaded module.
  require('@google-cloud/debug-agent').start({
  allowExpressions: true,
  projectId: process.env.GOOGLE_CLOUD_PROJECT_ID,
});
Below is the list of supported configs.
| Name | Type | Description |
|---|---|---|
workingDirectory |
string |
|
allowRootAsWorkingDirectory |
boolean |
|
description |
string |
|
allowExpressions |
boolean |
If yes, it will be permitted to evaluate expressions |
serviceContext |
|
|
appPathRelativeToRepository |
string | Path within your repository to the directory containing the package.json |
logLevel |
number |
level 0-disabled, 1-error, 2-warn, 3-info, 4-debug |
breakpointUpdateIntervalSec |
boolean |
Interval to refresh list of breakpoints from the cloud server. |
breakpointExpirationSec |
number |
Breakpoints and logpoints older than this number of seconds will be expired on the server. |
capture |
|
|
log |
|
|
internal |
|
|
forceNewAgent_ |
boolean |
Force loading a new agent |
testMode_ |
boolean |
Cause the start() function to return the debuglet |
After adding the code, restart your app. Then open Cloud Debugger Console and select your application. It's very recommended to load your code to the console so you can easily set where to capture snapshots and add logpoints.
There are some ways to add your source code
- Local code
- Online repositories (currently only supports Google's Cloud Source Repositories, Github, Bitbucket, and Gitlab). It works for private repositories as well.
- Upload a source code capture to Google servers
After your code successfully loaded, you can start to capture snapshots and add logpoints.
Capture snapshots
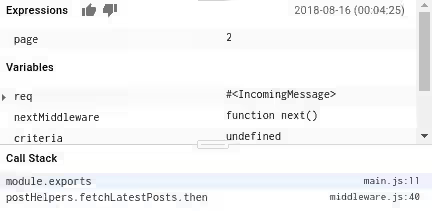
You can add some snapshots, so that when a certain part of code is hit, you'll get the value of snapshots. To add a snapshot, choose Snapshot on the right sidebar, than navigate to the line of code where you want to capture snapshots. You can specify a condition to only capture snapshot if the condition satisfied and expression for what values will be captured.

And here's the result after that line of code is hit

Add logpoints
Logpoint allows you to print the value of variables or just print any texts. It's very similar to adding console.log. The difference is it doesn't modify your code. Like adding snapshots, you can also specify a condition when a logpoint should be executed.

By using online Stackdriver Debugger, it's much easier to find bugs in production without affecting code behaviour. Moreover, setting up and using this Google's cloud debugger is very easy.
